Preshing on ProgrammingPreshing on Programming

High-Resolution Mandelbrot in Obfuscated Python

Here’s a followup to last month’s post about Penrose Tiling in Obfuscated Python.

The Mandelbrot set is a traditional favorite among authors of obfuscated code. You can find obfuscated code in C, Perl, Haskell, Python and many other languages. Nearly all examples render the Mandelbrot set as ASCII art.

The following Python script, on the other hand, begins as ASCII art:

_                                      =   (
                                        255,
                                      lambda
                               V       ,B,c
                             :c   and Y(V*V+B,B,  c
                               -1)if(abs(V)<6)else
               (              2+c-4*abs(V)**-0.4)/i
                 )  ;v,      x=1500,1000;C=range(v*x
                  );import  struct;P=struct.pack;M,\
            j  ='<QIIHHHH',open('M.bmp','wb').write
for X in j('BM'+P(M,v*x*3+26,26,12,v,x,1,24))or C:
            i  ,Y=_;j(P('BBB',*(lambda T:(T*80+T**9
                  *i-950*T  **99,T*70-880*T**18+701*
                 T  **9     ,T*i**(1-T**45*2)))(sum(
               [              Y(0,(A%3/3.+X%v+(X/v+
                               A/3/3.-x/2)/1j)*2.5
                             /x   -2.7,i)**2 for  \
                               A       in C
                                      [:9]])
                                        /9)
                                       )   )

Timing Your Code Using Python’s “with” Statement

It’s common to want to time a piece of code. In Python, the with statement provides a convenient way to do so.

If you’ve followed my previous post, The Python with Statement by Example, you should have no problem following along here. All you need is a class which implements the __enter__ and __exit__ methods:

import time

class Timer:    
    def __enter__(self):
        self.start = time.clock()
        return self

    def __exit__(self, *args):
        self.end = time.clock()
        self.interval = self.end - self.start

Of course, this is not a revolutionary idea. We’re just subtracting a couple of time.clock calls. If you google around, you’ll find several people suggesting to use the with statement in the same way. I’ve only tweaked the implementation details.

The Python “with” Statement by Example

Python’s with statement was first introduced five years ago, in Python 2.5. It’s handy when you have two related operations which you’d like to execute as a pair, with a block of code in between. The classic example is opening a file, manipulating the file, then closing it:

with open('output.txt', 'w') as f:
    f.write('Hi there!')

The above with statement will automatically close the file after the nested block of code. (Continue reading to see exactly how the close occurs.) The advantage of using a with statement is that it is guaranteed to close the file no matter how the nested block exits. If an exception occurs before the end of the block, it will close the file before the exception is caught by an outer exception handler. If the nested block were to contain a return statement, or a continue or break statement, the with statement would automatically close the file in those cases, too.

Penrose Tiling Explained

Last week, I posted some obfuscated Python which generates Penrose tiling. Today, I’ll explain the basic algorithm behind that Python script, and share the non-obfuscated version.

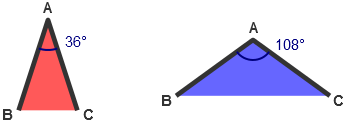
The algorithm manipulates a list of red and blue isosceles triangles. Each red triangle has a 36° angle at its apex, while each blue triangle has a 108° angle.

In Python, we can represent such triangles as tuples of the form (color, A, B, C). For the first element, color, a value of 0 indicates a red triangle, while 1 indicates blue. The rest of the tuple gives the co-ordinates of the A, B and C vertices, expressed as complex numbers. Complex numbers work well here since they can represent any point on the 2D plane – the real component gives the x co-ordinate, while the imaginary component gives the y co-ordinate.

Penrose Tiling in Obfuscated Python

Who says you can’t write obfuscated Python?

Here’s a Python script which renders some Penrose tiling. Yes, this is valid Python code:

_                                 =\
                                """if!
                              1:"e,V=100
                            0,(0j-1)**-.2;
                           v,S=.5/  V.real,
                         [(0,0,4      *e,4*e*
                       V)];w=1          -v"def!
                      E(T,A,              B,C):P
                  ,Q,R=B*w+                A*v,B*w+C
            *v,A*w+B*v;retur              n[(1,Q,C,A),(1,P
     ,Q,B),(0,Q,P,A)]*T+[(0,C            ,R,B),(1,R,C,A)]*(1-T)"f
or!i!in!_[:11]:S       =sum([E          (*x)for       !x!in!S],[])"imp
  ort!cair               o!as!O;      s=O.Ima               geSurfac
   e(1,e,e)               ;c=O.Con  text(s);               M,L,G=c.
     move_to                ,c.line_to,c.s                et_sour
       ce_rgb                a"def!z(f,a)                :f(-a.
        imag,a.       real-e-e)"for!T,A,B,C!in[i       !for!i!
          in!S!if!i[""";exec(reduce(lambda x,i:x.replace(chr
           (i),"\n "[34-i:]),   range(   35),_+"""0]]:z(M,A
             );z(L,B);z         (L,C);         c.close_pa
             th()"G             (.4,.3             ,1);c.
             paint(             );G(.7             ,.7,1)
             ;c.fil             l()"fo             r!i!in
             !range             (9):"!             g=1-i/
             8;d=i/          4*g;G(d,d,d,          1-g*.8
             )"!def     !y(f,a):z(f,a+(1+2j)*(     1j**(i
             /2.))*g)"!for!T,A,B,C!in!S:y(M,C);y(L,A);y(M
             ,A);y(L,B)"!c.st            roke()"s.write_t
             o_png('pen                        rose.png')
             """                                       ))

xkcd Password Generator

The button below will generate a random phrase consisting of four common words. According to yesterday’s xkcd strip, such phrases are hard to guess (even by brute force), but easy to remember, making them interesting password choices.

correct horse battery staple

It’s a novel idea, but xkcd stops short of actually recommending such passwords, and so will I. Use at your own peril! I’m not responsible for anything that happens as a result of your password choice. (But if you’re just signing up for a kitten video forum, you’re probably safe.)

In case you missed the strip, here it is:

The Cost of _SECURE_SCL

_SECURE_SCL is a preprocessor definition which affects the behavior of Standard C++ Library containers, like std::vector, std::map and std::list. In Visual C++ 2005 and 2008, its default value is 1, which means it’s enabled by default in Release.

If you search the Visual C++ Include Directories for _SECURE_SCL (and _SCL_SECURE), you’ll find hundreds of conditional compilation directives. To make a long story short, the _SECURE_SCL definition is meant to protect you against programming errors like this one:

void main()
{
    std::vector<int> vector;
    *vector.end() = 0;
}

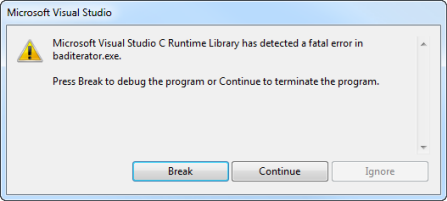
When the above program runs, it pops up the following error message:

This is arguably a Debug check. Why, then, is it enabled by default in Release? My guess is that it’s enabled for the same reason as Buffer Security Checks – to minimize security vulnerabilities. After all, “SECURE” is right there in the name. Nonetheless, Microsoft changed their mind in Visual C++ 2010, and it’s no longer enabled by default. Perhaps this kind of programming error is not a common attack vector after all. Or perhaps the risk of exploitation is already mitigated by Address Space Layout Randomization, which was introduced in Windows Vista. I’m only speculating.

The Cost of Buffer Security Checks in Visual C++

The Buffer Security Check (/GS) compiler option is enabled by default in Release. It catches buffer overruns like the following:

void main()
{
    char buf[16];
    strcpy(buf, "This string is too long!"); // Buffer overrun
    puts(buf);
}

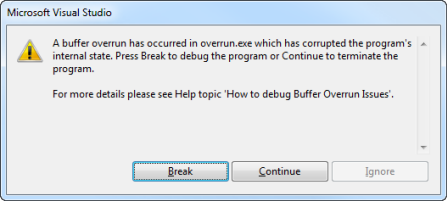
If you run the above program from the debugger, it pops up the following error message:

Outside the debugger, the program will simply crash before it can do further damage.

This compiler option is meant to catch overruns of fixed-size arrays located on the stack. When enabled, the compiler emits a few extra instructions at the start of the function, to insert a “security cookie” on the stack, and a few extra instructions before the return, to check that the security cookie hasn’t changed.

The Cost of Enabling Exception Handling

When you create a 32-bit application in Visual C++ 2008, the Release configuration comes with exception handling, buffer security checks, and _SECURE_SCL enabled by default. In the next few posts, I’ll illustrate the cost of each of these features, using wordcount.exe from Hash Table Performance Tests as a test application.

The cost of exception handling is not exactly news. Several years ago, at a training session for console game developers, we were advised to disable it in our engines. Basically, we were told that by enabling this feature, and not even using it, we were adding overhead across the entire executable, and it was a big waste of performance at runtime. Of course, wordcount.exe is just a tiny Win32 application, and not a big console game – but it’s still interesting to take a look at a few benchmarks, and get some idea what they were talking about.

How the Compiler Supports Exception Handling

The reader should already be familiar with exception handling in C++. One important detail, which requires compiler support, is stack unwinding. Any time a C++ exception is thrown (and caught), the system must be prepared to call the destructors of any intermediate C++ variables located on the stack. But how does the system know which destructors to call? The answer is platform- and compiler-specific.

Finding Bottlenecks by Random Breaking

Sometimes, a series of random breaks into the debugger can help identify bottlenecks in your code. The more running time taken by a function, the greater the probability it will appear on the callstack. If the same function shows up five out of ten times, your application is likely spending 50% of its time inside it. This rudimentary technique is kind of like PC sampling with stack walking, but with an extremely low sampling rate. Therefore, it works best when there is a really significant bottleneck to find. The nice thing about it is that no special profiling tools are required – just the debugger.

I used this trick while developing a small test program for an earlier post, Hash Table Performance Tests. The goal was to find and eliminate any hidden bottleneck which could skew the results. First, I discovered that the Windows heap is slow when launched from the debugger. After that, I found two other bottlenecks using the same technique. Both were fairly obvious, so this post won’t exactly break any new ground, but I thought I’d share them here as part of a series about Visual C++ Performance Pitfalls.